Last updated on June 27th, 2022 at 01:49 pm
Using Google Analytics
Google Analytics is a free analytics tool that gives you detailed data on your website visitors and their actions on your site. For example, it can show what people searched for to find your website, which are your most popular pages, where your website visitors lived, and other useful information.
NOTE: This article refers to ‘Universal Analytics’, which will no longer process data from July 2023. It will be replaced by ‘Google Analytics 4’ – learn how to set up Google Analytics 4 to start collecting data now.
In order to access Google Analytics you need to have or create a Google account. You also need to add some of Google’s ‘tracking code’ to each of your website pages that you wish to monitor. After adding the tracking code it may take a few hours before Google Analytics starts collecting your data.
Google Analytics provides many different reports that help you know which areas of your website need improvement.
The Main Dashboard Tabs
There are four main tabs in the Google Analytics account: Home, Customisation, Reports and Admin.
Home Tab
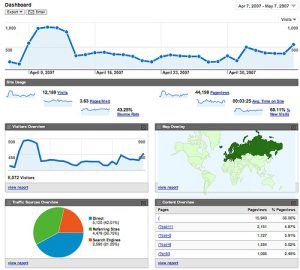
The Home tab provides a quick overview of your account, including information about sessions, average session duration, bounce rate, etc. Sessions refers to the number of interactions on your website that occur during a particular timeframe. The Average Session Duration is the average duration of the sessions. The Bounce Rate means the percentage of users who have “bounced off” (left) your website at some point.
Customisation Tab
The Customisation tab lets you create and track custom reports according to your particular needs.
Reports Tab
Next, the Reports tab provides important reports that can show how your website is performing, so that you can know where and how to make improvements. Real time reports show actions that have occurred on your site in the last five minutes. Audience reports tell you everything you want to know about your visitors, such as their age, gender and location. Acquisition reports are about what drove visitors to your website. Behaviour reports are about your content, such as your most popular pages.You can also learn how fast your website loads (Site Speed) as well as find specific suggestions from Google on how to make your website faster (Site Speed > Speed Suggestions). Conversion reports can be used if you have set up Google Analytics goals for your website.
Admin Tab
In the Admin tab you can manage account and property settings. You can set goals, create user segments, set up alerts, set up scheduled emails and more. If you have AdWords and AdSense accounts you can link them in order to measure the performance of your campaigns.
What you can Measure
Here are 10 examples of things you can measure:
1. The number of daily visitors
This is found in the audience overview report. It gives you an overview of the number of people who have visited your website. To find the report, you can navigate to Audience » Overview.
2. Average conversion rate
You can set up goals in order for Google Analytics to track important activity on your website. This will enable Google Analytics to track your ‘conversions’ such as a user completing a purchase on your website. You can create up to 20 goals whenever a specific activity is triggered, such as an email sign up or document download.
3. Which are your most visited pages
This report is found under Behaviour » Site Content » All Pages. The page ‘/’ refers to your home page. A pageview is an instance of a page being loaded (or reloaded) in a browser. Unique pageviews counts the number of sessions where a unique page is viewed at least once.
4. What is the average time spent on your website
Similarly, this report is found under Behaviour » Site Content » All Pages.
5. How often do visitors return
You can find this report under Audience » Behaviour » New vs Returning.
6. What is the geographic distribution and language setting of visitors
These reports are found under Audience » Geo » Location and Audience » Geo » Language
7. What is the “bounce rate”
To find out if visitors stay on your website, or leave after just visiting one single page you can look at Behaviour » Site Content » All Pages.
8. Which pages do visitors view first or last before they leave
These reports can be found under Behaviour » Site Content » Landing Pages and Behaviour » Site Content » Exit Pages
9. Are visitors using a tablet, desktop or mobile device
You can find this report under Audience » Mobile.
10. If a visitor came to your website via a search engine, which keywords did they use to search.
This report can be found under Acquisition » Search Console » Queries.
Conclusion
Google Analytics is an excellent free tool that can be used to measure the success and improve the performance of a blog or website. It can provide you with useful information for improving your website and maximising its performance.
I hope you enjoyed reading this article and learning more about Google Analytics.
Call Jane Walker on 0777 169 1194 for free advice or to chat about regular help.
You may be interested in reading our Website Health check article.